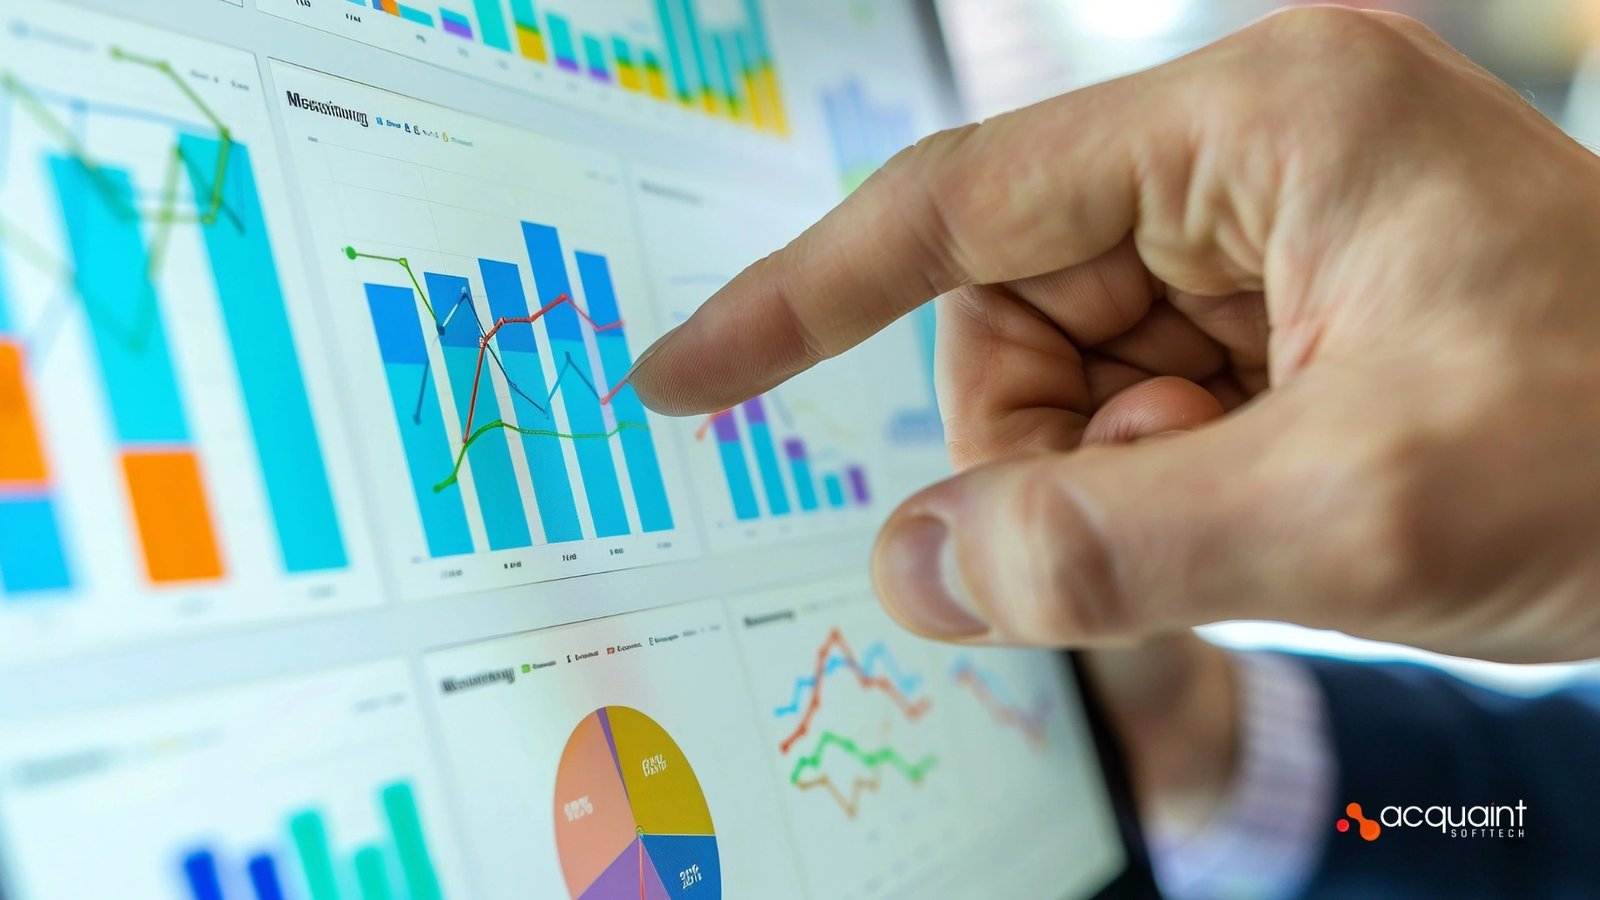
Real-Time Analytics for SaaS: Using ClickHouse, Druid, or TimescaleDB

| On This Page 1. When Your Dashboard Is Already Out of Date 2. What Is Real-Time Analytics for SaaS? 3. ClickHouse vs Druid vs TimescaleDB 4. The Architecture of a Real-Time Analytics Pipeline 5. Dashboards, Multi-Tenancy, and Decisions 6. How to Build It: Steps, Stack, Cost, Timeline 7. Real Case Study: Predictive Analytics for a Diagnostics Group 8. FAQs |
By the time your nightly report runs, the spike that mattered is already over. Batch dashboards tell you what happened yesterday, but SaaS users increasingly expect to see what is happening now.
As the technology and client success lead at Acquaint Softtech, I have helped teams move from slow overnight rollups to analytics that update in seconds. Our Python development team builds the pipelines and stores that make real-time analytics dependable, not just fast.
Bolting analytics onto your transactional database seems easy until heavy queries slow down the product everyone is paying for. The hard part is architecture: ingesting events, storing them for fast aggregation, and serving dashboards to many users at once the very concerns the US government’s NIST Big Data framework was built to standardize. Choose the wrong engine, and you either pay too much or wait too long for every query.
This guide compares ClickHouse, Druid, and TimescaleDB, then walks through the architecture, dashboards, cost, and a real case study. It pairs with our wider SaaS data and analytics guide. Read on, then pick an engine and a pipeline that fit your data, your users, and your budget.
When Your Dashboard Is Already Out of Date
Most SaaS starts by running analytics on the same database that serves the app, which works until it does not. A few heavy aggregation queries can lock tables and slow the product for paying users, and reporting that runs overnight hides problems for hours. Treating analytics as its own system, not a query on your main database, is a software product development decision worth making early.
Why do analytics on your main database fail?
Transactional databases are tuned for many small reads and writes, not for scanning millions of rows to compute a trend. As data grows, those queries crawl, dashboards time out, and engineers bolt on caches that quickly go stale. The fix is a separate, columnar or time-series engine built for aggregation. Recognizing when to make that split is a virtual CTO services call.
What does slow data actually cost?
The business cost is decisions made on stale data: churn spotted a week late, an outage trend noticed only after customers complain, usage caps enforced after the fact. Real-time signals turn those misses into timely action. Defining which metrics must be real-time and which can wait is a core discovery workshop task.
What Is Real-Time Analytics for SaaS?
Real-time analytics is the practice of ingesting events as they happen and making them queryable within seconds, so dashboards reflect now rather than last night. The events can come from anywhere: app usage, payments, IoT sensors, or a hire WordPress Developers storefront, and they flow continuously into an analytics store.
Real-time vs batch: what is the difference?
Batch analytics collects data and processes it on a schedule, hourly or nightly, which is cheap and fine for long-term trends. Real-time, or near-real-time, processes events continuously, so a hire WooCommerce store can watch sales and stock shift live. Most SaaS needs both: real-time for operational signals, batch for deep historical analysis.
What are the benefits and 2026 trends?
Real-time analytics powers live dashboards, instant alerts, usage-based billing, and faster decisions across the business. In 2026, the trend is user-facing analytics, embedding fast dashboards directly inside your product, alongside streaming-first pipelines. Building that to a high bar is where experienced IT staff augmentation engineers help most.
Does every SaaS need real-time analytics?
No, and pretending otherwise wastes money. If your users look at numbers once a day and act on weekly trends, a nightly batch job is simpler, cheaper, and perfectly adequate. Real-time earns its cost when seconds matter: live operational dashboards, fraud and anomaly alerts, usage metering, and analytics you sell back to customers inside the product.
The honest first step is to separate the metrics that truly need to be live from the ones that only feel urgent, then build real-time only where it changes a decision.
ClickHouse vs Druid vs TimescaleDB
The three popular engines solve overlapping, but different problems, and the right pick depends on volume, concurrency, and how many operations you can take on. ClickHouse is a columnar OLAP database built for blazing aggregations over huge event volumes, Druid is a real-time OLAP engine for sub-second, high-concurrency dashboards on streaming data, and TimescaleDB is a PostgreSQL extension for time-series that keeps you in familiar SQL. Running any of these reliably in production is DevOps work.
Which engine fits which job?
| Dimension | ClickHouse | Apache Druid |
| Type | Columnar OLAP | Real-time OLAP |
| Best for | High-volume events | Live, high-concurrency |
| Ingestion | Batch + streaming | Streaming-first |
| Query latency | Very fast on aggregates | Sub-second, concurrent |
| Ops effort | Moderate | Higher |
| Choose when | Massive event volumes | Many concurrent users |
ClickHouse shines for high-volume event analytics and internal dashboards at low cost, Druid shines when many users hit live data at once, and TimescaleDB shines when you already run Postgres and want time-series without a new system. Many teams start on TimescaleDB and move to ClickHouse as volume explodes. Choosing and operating the right one is work for dedicated development teams.
How do you query the engine you choose?
Whatever the engine, your product talks to it through an API layer rather than connecting dashboards straight to the database. A Python or hire Django service is a natural fit for that query API and for the transforms that feed the store, keeping the analytics layer cleanly separated from the app.
What about the cost of running each engine?
Engine choice is also a cost decision, not just a performance one. TimescaleDB is usually cheapest to start because it rides on Postgres infrastructure you may already run and staff. ClickHouse is famously efficient on storage and compute for large volumes, so it often wins on cost per billion rows once you are at scale.
Druid delivers the lowest query latency under heavy concurrency but asks for the most operational investment, with several node types to run and tune. Match the engine to the bill you can sustain, not just the benchmark you admire.
The Architecture of a Real-Time Analytics Pipeline
A real-time analytics pipeline has four stages: ingest events, optionally process the stream, store them in an analytics engine, and serve queries to dashboards. The golden rule is to keep this separate from your transactional database so analytics never slows the product. Ingestion APIs are often built in Python, Node, or hire Laravel developers, depending on your stack.
What are the core components?
A typical setup streams events through Kafka or a managed equivalent, optionally pre-aggregates them into rollups, stores them in ClickHouse, Druid, or TimescaleDB, and exposes a query API that dashboards call. Pre-aggregation and materialized views are what make queries feel instant instead of scanning raw events every time. The dashboard front ends are often built by hired MERN stack developers.
How do you keep queries fast and correct?
Speed comes from rollups, sensible partitioning, retention that downsamples old data, and caching the most common queries. Correctness comes from handling late or out-of-order events so totals do not drift. Keeping these tuned as data volume grows is a support and maintenance job, not a one-time setup.
How do you handle late or out-of-order events?
Streams are messy: a mobile client goes offline and flushes events an hour late, or two services report the same event twice. A robust pipeline timestamps events at the source, processes within a tolerance window, and uses idempotent keys so duplicates do not inflate totals.
For figures that must eventually be exact, such as billing, a periodic batch job reconciles the real-time numbers against the source of truth. Designing for messiness up front is far cheaper than explaining wrong numbers later.
Dashboards, Multi-Tenancy, and Decisions
Analytics only matters when people act on it, so dashboards must be fast, clear, and scoped to the right user. For SaaS, that usually means per-customer, multi-tenant views where each tenant sees only their own data. Interactive dashboards like these are often built by hired MEAN stack developers.
How do you serve per-tenant analytics safely?
Multi-tenancy in analytics means filtering every query by tenant and never letting one customer glimpse another’s metrics, enforced in the query layer rather than hidden in the UI. The same dashboards increasingly appear inside mobile apps, which React Native developers build against the same query API.
Where do alerts and predictions fit?
Beyond charts, real-time data powers alerts that notify when a metric crosses a threshold, and prediction that forecasts churn or load before it happens. Streaming data is the foundation both rely on. Layering models on top of the stream is part of our AI development services.
What makes a real-time dashboard people actually trust?
Speed is wasted if users do not believe the numbers. Trust comes from a few disciplines: show when the data was last updated, label whether a figure is live or reconciled, and make totals reconcile with the source of truth so finance and operations see the same number.
Avoid cramming every metric onto one screen; surface the few signals that drive action and let users drill into the rest. A fast dashboard that contradicts the monthly report gets abandoned, while a clear, consistent one becomes the screen teams leave open all day.
How to Build It: Steps, Stack, Cost, Timeline
Building real-time analytics follows a clear order: define the metrics, choose the engine, build ingestion, add rollups, serve a query API, then dashboards and alerts. The value is in fast, correct queries under load, not a single impressive chart. Delivering this affordably is core software development outsourcing work.
How do you build it, step by step?
This is the order we follow on real builds:
1. Define the metrics and events that genuinely need to be real-time.
2. Choose an engine: TimescaleDB, ClickHouse, or Druid.
3. Build streaming ingestion separate from your application database.
4. Pre-aggregate into rollups and set retention and downsampling.
5. Serve a multi-tenant query API.
6. Build dashboards, then add alerts and anomaly detection.
7. Load-test for concurrency before you launch.
How much does it cost, and how long does it take?
A focused real-time analytics MVP, one engine, streaming ingestion, and a few dashboards, runs about four to eight weeks, while a production system with multi-tenancy, rollups, alerting, and prediction takes eight to sixteen. Migrating analytics off your main database is a defined version upgrade services project, and India-based teams deliver the same quality at up to 40% lower cost.
What tech stack is best for real-time analytics?
A common stack is Python for ingestion and transforms, Kafka or Redpanda for streaming, ClickHouse, Druid, or TimescaleDB for storage, a FastAPI query layer, and Grafana, Metabase, or a custom React app for dashboards. The predictive layer on top, forecasting and anomaly detection, is built by hiring AI/ML engineers.
| Layer | Recommended Tech | Role |
| Ingestion | Python + Kafka / Redpanda | Stream events reliably |
| Storage | ClickHouse / Druid / TimescaleDB | Fast aggregation at scale |
| Query API | FastAPI or Node | Multi-tenant, cached queries |
| Dashboards | Grafana / Metabase / React | Visualize and explore |
| Prediction | Python ML on the stream | Alerts and forecasts |
Real Case Study: Predictive Analytics for a Diagnostics Group
Real-time analytics earns its keep when faster signals change real outcomes. That was the case for BIANALISI, Italy’s largest integrated diagnostics group, which needed to turn laboratory and clinical data into early-warning intelligence. Running a regulated, multi-region analytics build like this on clear milestones is where a strong project manager keeps medical and engineering teams aligned.
Read Also: Find Reliable Coverage for Every Stage of Life
How we delivered it
The work ran in structured phases: discovery, data validation, modeling, dashboard development, pilot deployment, and refinement. We built a secure ingestion layer for lab records and imaging metadata, cleaned and structured partially anonymized datasets, developed predictive risk models, and exposed access-controlled APIs with audit trails aligned to European data rules.
Throughout, laboratory specialists validated model assumptions so the outputs stayed clinically interpretable. The wider portfolio of analytics work sits on our case studies page.
The result
Within pilot regions, clinical directors detected clusters of abnormal diagnostic trends within the same reporting cycle instead of after monthly audits, and consolidated trend analysis that previously required manual extraction from many regional systems.
In one case, a supervisor spotted an unusual spike on the dashboard and initiated review immediately rather than waiting for periodic analysis. Teams scaling analytics builds like this often hire remote developers with strong Python and data experience.
FAQs
What is real-time analytics for SaaS?
It is ingesting events as they happen and making them queryable within seconds, usually on a dedicated engine like ClickHouse, Druid, or TimescaleDB, separate from your application database.
ClickHouse vs Druid vs TimescaleDB: which is best?
ClickHouse for high-volume event analytics, Druid for high-concurrency live dashboards, and TimescaleDB for time-series on Postgres. The best fit depends on volume, concurrency, and ops capacity.
How much does real-time analytics cost to build?
A focused MVP is four to eight weeks; a full multi-tenant system with alerts and prediction is eight to sixteen. India teams cut costs up to 40%.
What features does real-time SaaS analytics need?
Streaming ingestion, a fast analytics store, pre-aggregated rollups, a multi-tenant query API, dashboards, alerting, retention with downsampling, and access control.
How long does development take?
Four to eight weeks for an MVP; eight to sixteen weeks for a production system with multi-tenancy, rollups, alerting, and prediction.
Can I just use my main database for analytics?
For small data, yes; at scale, heavy queries slow your app, so a separate analytics engine is the standard fix.
What tech stack is best for real-time analytics?
Python for ingestion, Kafka or Redpanda for streaming, ClickHouse, Druid, or TimescaleDB for storage, a query API, and Grafana, Metabase, or a custom dashboard.